One of the first major programs I led as a new Extension specialist at the University of Missouri was centered around a mobile near infrared spectroscopy (NIR) hay testing van. This was very advanced technology at the time, which was almost 40 years ago, or ‘in the 1900’s as I like to tell my students. I was the equivalent of the Little Red Hen of children’s books, as I would drive up in the van, plug it in, process samples, test the samples, hand out the sample results and then present the educational meeting.
I was surprised at the nearly universal reaction of farmers when I handed them their results. Nearly every time, they would hand the report back to me and ask me, ‘is it any good?’ As a new specialist my lack of depth and working knowledge of forages was shocking – I assumed that everyone knew more about forage reports than I did. Surely the report itself was sufficient, that it would speak for itself.
Wrong.
I need to acknowledge up front that the absolute best and most proven way to evaluate forage quality is the performance of the animal to be fed. While true, it is certainly an ‘after the fact’ kind of revelation. Kind of like predicting the score of a football game the day after it was played. One hundred percent accurate but not very helpful.
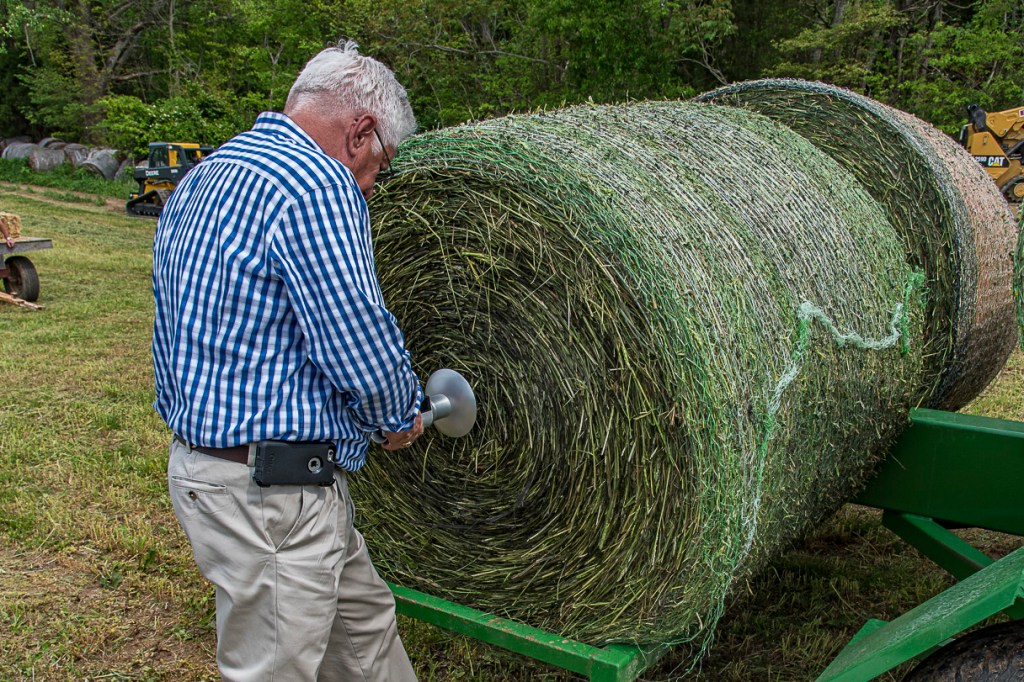
To get a good forage analysis, start with a good sample which is composed of cores from 15 to 20 bales of hay that are representative of the lot. Submit the whole sample to a certified forage laboratory. Most of the forage tests today are done using NIR, which provides more information at lower cost than traditional wet chemistry methods.
Once you get the report, you are at a similar place as my Missouri farmers – wondering if the hay is any good? To answer that, at least partially, I will start with the hardest aspect of forage quality to understand – fiber. Fiber in the diet of ruminants and equine is inversely proportional to energy. Energy is the holy grail of forage quality because energy is the most limiting component of forages.
First, to say two things are inversely proportional, it means when one increases, the other decreases. With livestock, as forage fiber goes up, energy goes down. Think of the contrast in calories between shredded wheat (high fiber) and Breyers ice cream. To meet your daily energy needs, you would have to eat a lot of shredded wheat but only a little Breyers ice cream!
The same thing is true with forages, livestock have to consume much more of a high fiber forage to meet energy needs than with low fiber forages. And just as your stomach will max out after a couple of bowls of shredded wheat, livestock have a finite capacity to consume and digest high fiber feeds.
To find the fiber information on the forage test, look for ‘ADF’ (acid detergent fiber) and ‘NDF’ (neutral detergent fiber) values, and always look at the dry matter column. These terms are named from their respective lab techniques (and certainly not because they are very descriptive). Lower values are better and are associated with less mature, less stemmy forages.
ADF is the relatively indigestible fiber in a forage sample, containing cellulose, lignin and silica. Low ADF values indicate high energy forages. ADF. I will make the bold statement that ADF tells more about your forage than almost any other parameter because it is a key determinant of our main energy term for ruminants, TDN (total digestible nutrients).
NDF is the total fiber in a forage sample and is made up of cellulose, hemicellulose, lignin, and ash. NDF is used to estimate intake, and low NDF numbers are desired. Low NDF values indicate livestock can consume more forage.
So if you know ADF and NDF, how do you know if hay is any good? I created Table 1 to help with that. Find your value of ADF and/or NDF in the table and you will get my evaluation of the relative quality of the hay, high, medium or low. This table is based on experience and other reports may vary.
| Table 1. Definition of high, medium and low quality forages based on percent (%) ADF or NDF. | |||
| High | Medium | Low | |
| ADF – All forages | 25-35 | 36-50 | >50 |
| NDF – Legumes | 35-45 | 46-60 | >60 |
| NDF – Grass/Small Grains/Summer Annuals | 45-55 | 56-70 | >70 |
So now you how to tell a little more about your hay, including whether it can be considered high, medium or low in quality. My analysis here is a gross simplification of a very complex subject that I will write more about in coming columns. For now, it is sufficient to know that low fiber (ADF and NDF) values are desirable because that means a forage is higher in energy and can be consumed in larger quantities.
Happy foraging.
~ Dr. Jimmy Henning, University of Kentucky Forage Extension Specialist, reprinted with permission from Farmers Pride Magazine, November, 2023
